In this last post about the apps I noticed I was running daily that are in the Top Charts on the App Store I want to talk a little bit about tracking your heart rate. The app I’m using is called HeartWatch. Like sleep tracking and water tracking before it, if you are not currently tracking your heart rate...you may want to consider it.
Why do you ask is it necessary to track your heart rate? I have found that tracking my heart rate has helped me look at my day in general in a more mindful way. More on that in the last section of this post. I also use my heart rate to evaluate the type of day it was...another thing I would like to explore in the last section of this post.
Here are a series of pictures of what you see when you open the app up... What you are looking at is the Regular Heartbeat screen.

At the top of the screen you can see the days of the week with a badge. Inside the badge is the average heartbeat for the entire day. Below this you find a definition of what a regular heartbeat is. I love this about the app. The explanations really help you better understand what you are looking at. Next to the big badge you will find your average, minimum, and maximum heart rate numbers for the day...up to the point that you chose to check in. Below this is another really helpful piece of data in the form of a bar graph. This graph lets you know how much of the day was spent with an elevated, High Resting, or Resting heart rate. The thing I like about this is that it provides me the opportunity to reflect on the day...in an effort to evaluate the day...again...I will explore this later in the post.
Scroll a little bit and you’ll find the next section, the Waking Heartbeat screen.

This screen shows you what your heartbeat was when you woke up. There is a nice explanation of how this works just above your week at a glance. You can see that from January 27th-February 1st, my waking heartbeat went down daily...the number on the far right is what you waking heartbeat was (in my case...February 1st and what time the data was captured).
Scroll just a little more and you’ll find the next section, the Sedentary Heartbeat screen. There’s another simple explanation of what this data point measures. I do not use this data often but it’s nice to know it’s there if I’m interested. The Workout Heartbeat screen is waiting just below the Sedentary Heartbeat screen.

Again...I don’t look at this data often as I use my Apple Watch to analyze my workout data.
The screen I’d like to talk about next is Sleeping Heartbeat.
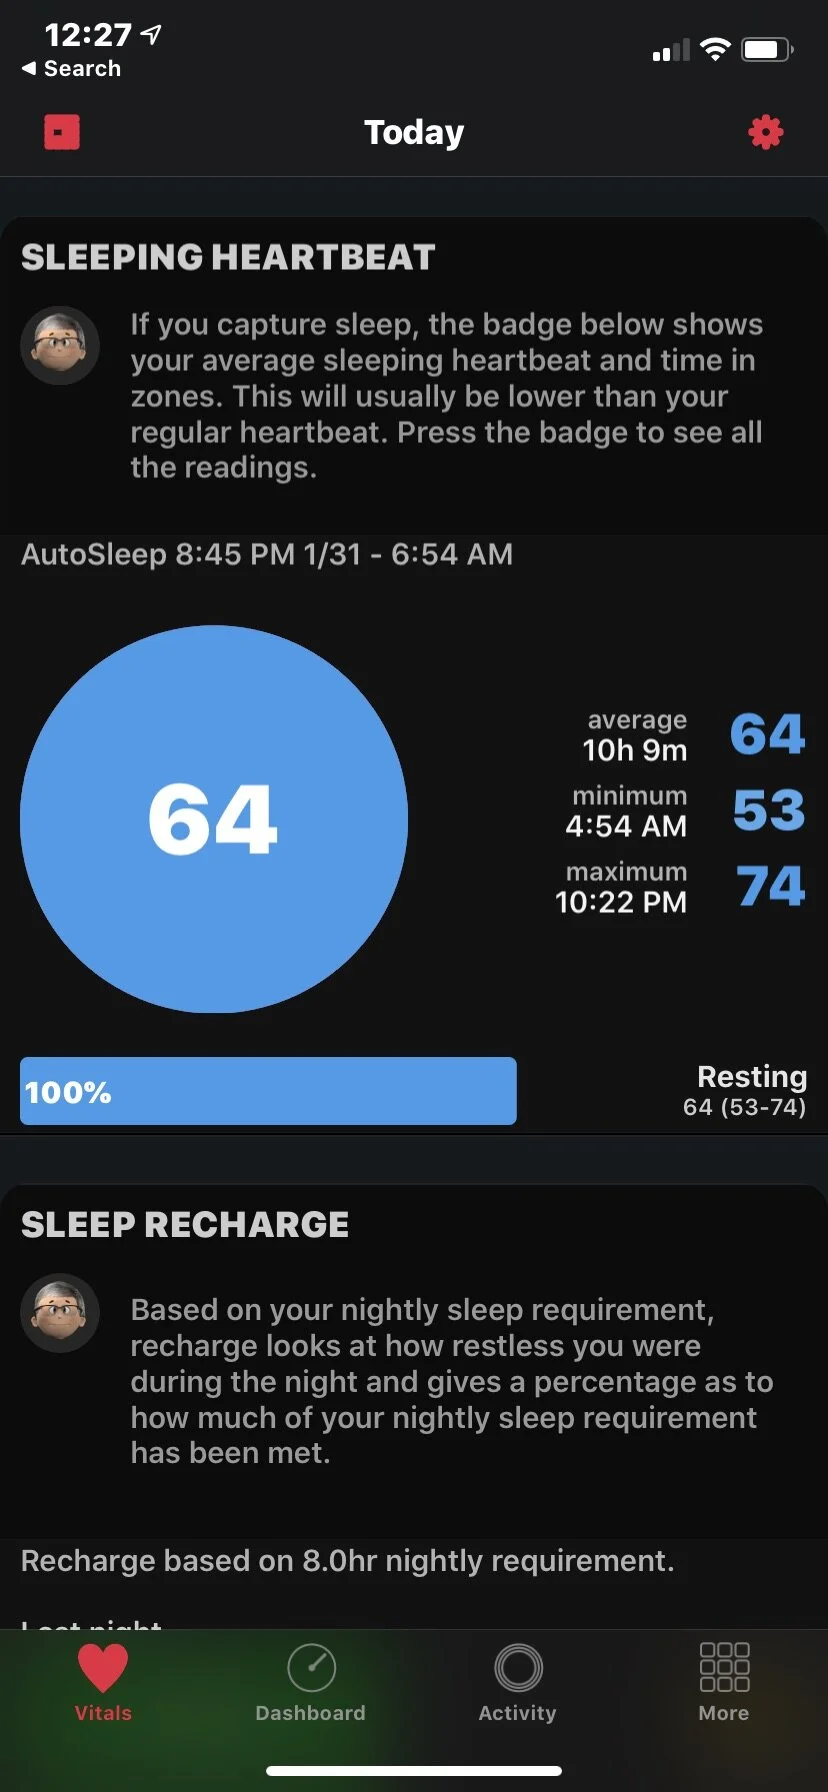
Like all of them before it...this screen comes with an explanation of both the badge and the bar graph. I do not spend much time with this data as I use AutoSleep and SleepWatch for all of my information. It’s nice to know this data is here though...I could use it to triangulate sleep information...if I so choose. Finally, below Sleeping Heartbeat is the Sleep Recharge screen.

Based on the nightly requirements of sleep you put into the app, this section lets you know how restless you were and how much of your nightly requirement was met.
How has this app helped me?
As you have probably figured out...I am using this app for a very targeted reason. I want to keep track of my regular heart rate throughout the day. HeartWatch is helping me be more mindful. Just behind the big badge that I described earlier is a graph that shows all kinds of data. Specifically...I can see any spikes in my heart rate throughout the day.
Look at this picture...

I can see that my heart rate spiked 3 times...once at about 8:30am when I found out (in real time) that the substitute teacher my students were supposed to have for library was running late and I had to disperse the group to other classes. The second time was right around noon on the playground dealing with a student who was having trouble with a classmate. The last one was around 12:30pm...as I was getting ready to switch classes to help a colleague that is out. Three moments in my day that bring with them all the stress and anxiety that comes with the job of teacher. The rest of the data points are purple or blue and remember... purple is ok and blue is really good. So with the exception of the 3 moments when my heart rate spiked...the rest of the day was good! Which brings me to my next point...using my heart rate to evaluate the day.
Readers of this blog know that my internal dialogue isn’t always nice to “me.” Collecting this kind of data is my way of talking back to that inner voice. In my mind...if I can keep my overall heart rate under 80...on a work day...with all the stress and anxiety that comes with being a teacher...I'm doing really good.
Readers of this blog also know that I wrote about each of the apps in this “mini-series” when I actually started using them for the first time. It’s been nice revisiting them as a result of my noticing them in the Top Charts on the App Store. It’s nice to know that others are as interested in tracking these things as I am. Each app...in its own way...has helped me cultivate a bit more of mental silence and it is THAT reason that I will continue using them!